Insights & Data
- Our Story & Values
- Sport Bay of Plenty Staff
- CoachForce Staff
- Our Board
- Employment
- Organisational Documents
The below reports provide insights into physical activity in the Bay of Plenty
Whether you're starting a new initiative, applying for funding or looking to learn more about physical activity in the Bay of Plenty and across Aotearoa, the below insights will help you make informed decisions that benefit participant of all ages.
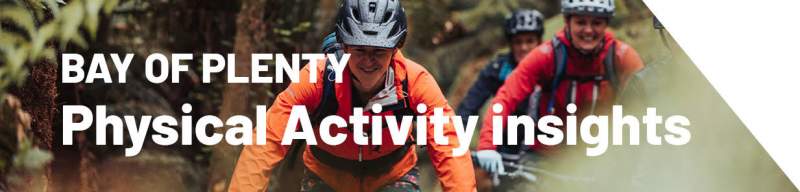
2021 Bay of Plenty Physical Activity Insights
The 2021 Bay of Plenty Physical Activity Insights documents provides a snapshot into the physical activity behaviours of people throughout the Bay of Plenty. the report looks at time spent being active across different age groups, where people are active and motivations and barriers to participation.
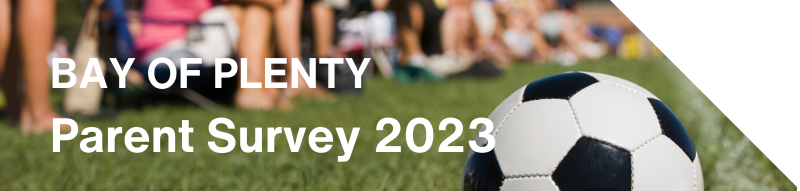
Bay of Plenty Parent Survey 2023
Sport Bay of Plenty wanted to get an understanding of what makes a good experience for parents of children involved in sport. Between April and September 2023, we interviewed 467 parents and guardians at local tournaments and events, capturing helpful insights, observations and connections along the way.
Bay of Plenty Voice of Coach report 2023
The Voice of Coach report 2023 provides insights into the current state of the coaching and sport development system in the Bay of Plenty. Information gathered from VoC will help guide Sport BOP toward informed decisions for their coaching support to provide the best experience possible for coaches and help strengthen the system in our region. The survey also provides information about the demographics of our coaching workforce.
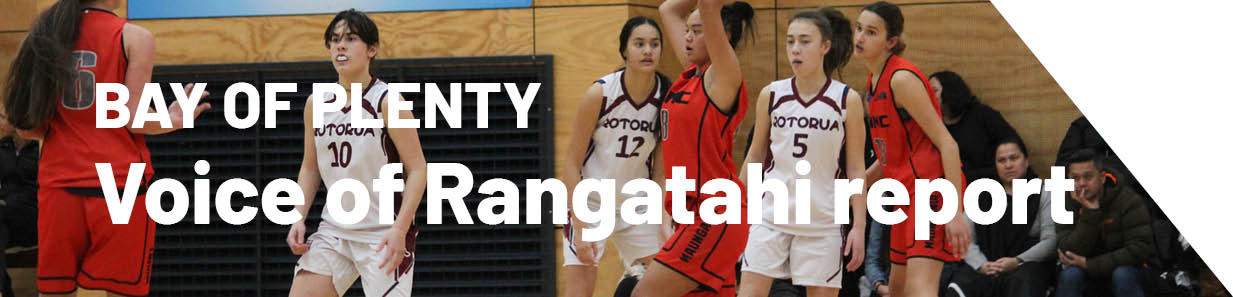
Voice of Rangatahi report 2022
The 2022 Voice of Rangatahi report provides insights into the physical activity patterns of Bay of Plenty rangatahi, including how they participate in physical activities in and out of school. Regional and national data shows time spent being active typically peaks at age 12 before dramatically declining and failing to rebound throughout a person’s life. A key strategic focus for Sport Bay of Plenty is therefore to support rangatahi aged 15 to 17 to be more active.
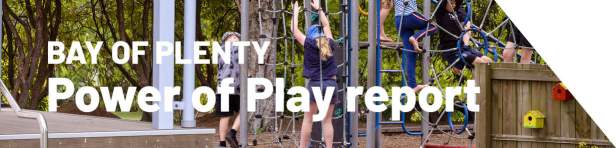
Power of Play Report
The Power of Play report explores findings from a study by Sport New Zealand Ihi Aotearoa and Sport Bay of Plenty, supported by Healthy Families East Cape He oranga whānau and the Innovation Unit. The report highlights the key influences of play in the Bay of Plenty, how play has changed over time and how people in our region play today.
Neighbourhood Play System report
Rotorua and Tauranga
The aim of a Neighbourhood Play System project is to understand how various urban systems impact children’s play experience in a selected community. They have been developed to reflect that play is not confined to defined areas, and encompasses a wide community system including driveways, streets, parks and alleys.